The guide
A genogram example, explained line by line
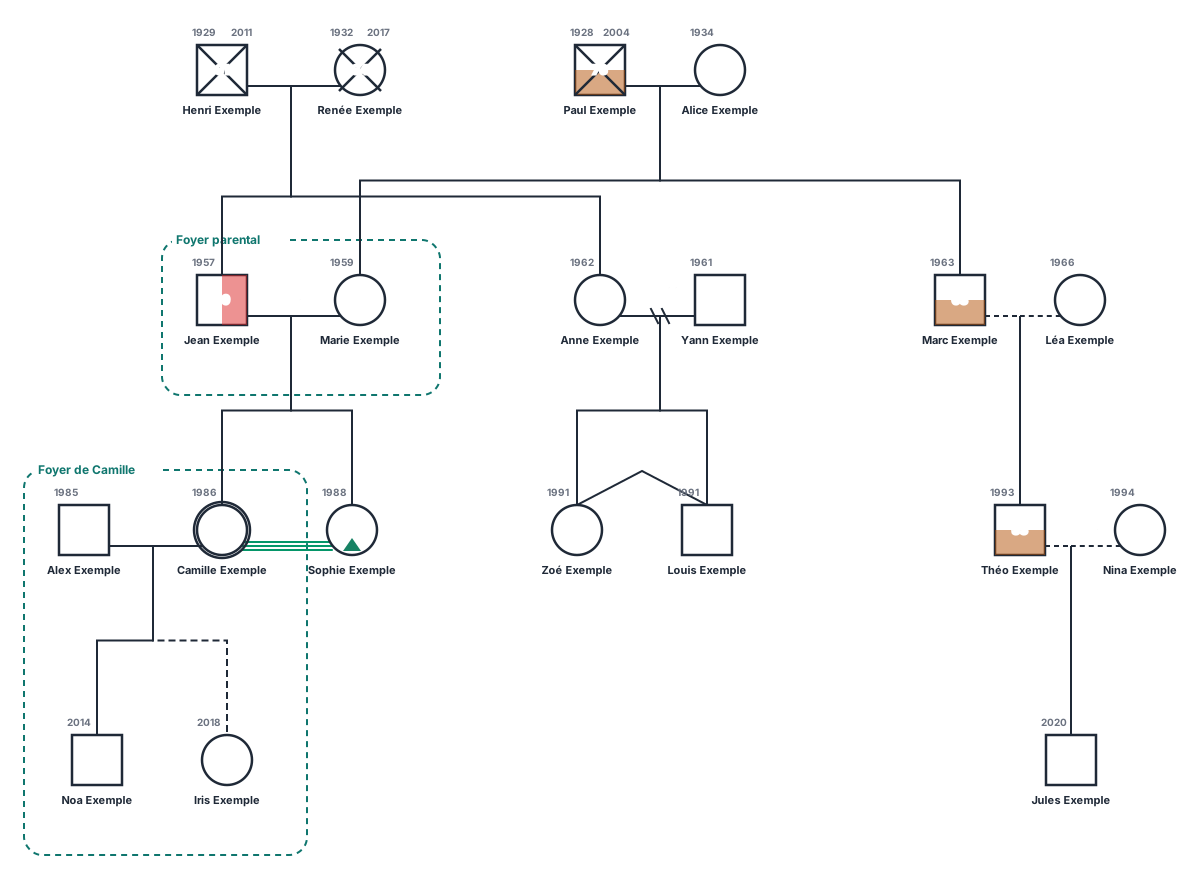
Nothing replaces reading a real diagram. This genogram example has four generations and about twenty people. It is entirely synthetic: the “Exemple” family does not exist, and no patient data was used to build it.
What reads without any training
| What you read | What it means |
|---|---|
| m 1954, m 1956 | Two marriages in the fifties: the first generation on the diagram |
| m 1988 d 2009 | Married in 1988, divorced in 2009. The union line carries the two slashes of divorce |
| LT 1990, LT 2018 | Living together. The line is dashed, and there is no marriage year because there is no marriage |
| 1929 2011 then 81 | Birth and death at the corners, age at death inside the shape. The shape is crossed out |
| 1934 then 91 | A single date: the person is alive, and the age is the current age |
| A dashed frame | These people live under the same roof |
Reading it generation by generation
Top: the grandparents
Two couples, married in 1954 and 1956. Three of the four are deceased — their shape is crossed out and carries two dates instead of one. The fourth, born in 1934, is 91: a single date, no cross.
That is already clinical information. A generation almost entirely gone, and one very old survivor, do not weigh on a family the way a couple of living grandparents would.
Middle: the parents and their sibships
Three couples, and three different forms of union on the same row: a marriage from 1982, a marriage from 1988 ended by divorce in 2009, and living together since 1990.
The divorce shows as two slashes on the union line. The dates stay: a divorce does not erase a marriage, it dates it a second time.
Then: the children grown up
This is where the diagram gets dense. Two people born the same year are joined by a Λ: twins. The Λ starts from a single point on the parent-child line, which distinguishes them from an ordinary sibship.
A green line joins two people of that generation: it is a close relationship. The structure says who descends from whom, the emotional layer says how they get on, and the two read separately.
A word on colour, because this guide claims elsewhere that a genogram reads without a legend: it is the form of the line that governs, not its hue. Colour is screen comfort only, and the diagram stays readable printed in black and white.
Bottom: the grandchildren
Three children born in 2014, 2018 and 2020. Their presence is what warrants a fourth generation: without them, one would have stopped at three.
The two households
Two dashed frames surround groups of people. They say who lives under the same roof, which the kinship structure does not.
It is often the most useful piece on the diagram, and the fastest forgotten when drawing it. Two people can be mother and daughter without sharing a roof; two others can share a roof with no kinship at all.
What this diagram does not say
Worth naming, because a genogram easily gives the impression of saying everything.
- It does not say why. The 2009 divorce is dated, not explained.
- It says nothing about the people absent from it: friends, colleagues, professionals, everyone who matters without being family. That is another tool's job, the ecomap (Hartman, 1975), which puts the family at the centre and draws its ties to its environment.
- It freezes a moment. A genogram is dated; a family's changes with it, and relationship qualities change faster than the rest.
- It does not interpret. Spotting a repetition of dates is an observation; drawing a conclusion from it is a clinical act, and belongs to the practitioner alone.
Drawing your own
This diagram was drawn with SpatioPsy Genogram and exported as vector — it is the very file you are looking at. Generations, unions and sibships are placed automatically.
Read next
-
Genogram symbols
The reference table: shapes, unions, parent-child lines, relationship quality, cutoffs and loss symbols.
-
How to draw a genogram
The method in six steps, from the index person to three generations, and the mistakes that cost the most.
-
Genogram, génosociogramme, family tree
Three objects that are often confused, and what actually separates them.
-
Download the software
SpatioPsy Genogram draws everything described here, and lays the diagram out on its own. Free until 30 November 2026.
Last updated: 23 August 2026